>> t=0:0.01e-3:0.06;
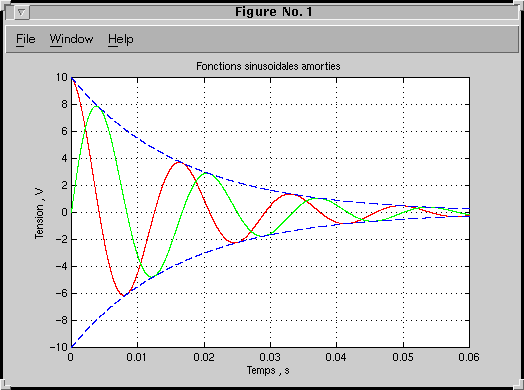
>> y=10*exp(-60*t).*cos(120*pi*t);
>> z=10*exp(-60*t).*sin(120*pi*t);
>> plot(t,y,'r',t,z,'g'),grid
>> a=10*exp(-60*t);
>> hold
Current plot held
>> plot(t,a,'b--')
>> plot(t,-a,'b--')
>> title('Fonctions sinusoidales amorties')
>> xlabel('Temps , s'),ylabel('Tension , V')

>> hold off
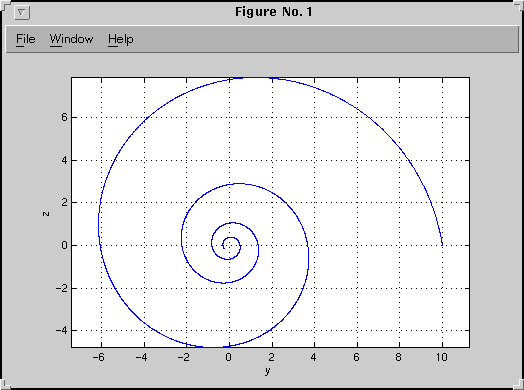
>> plot(y,z),grid
>> axis equal
>> xlabel('y'),ylabel('z')

